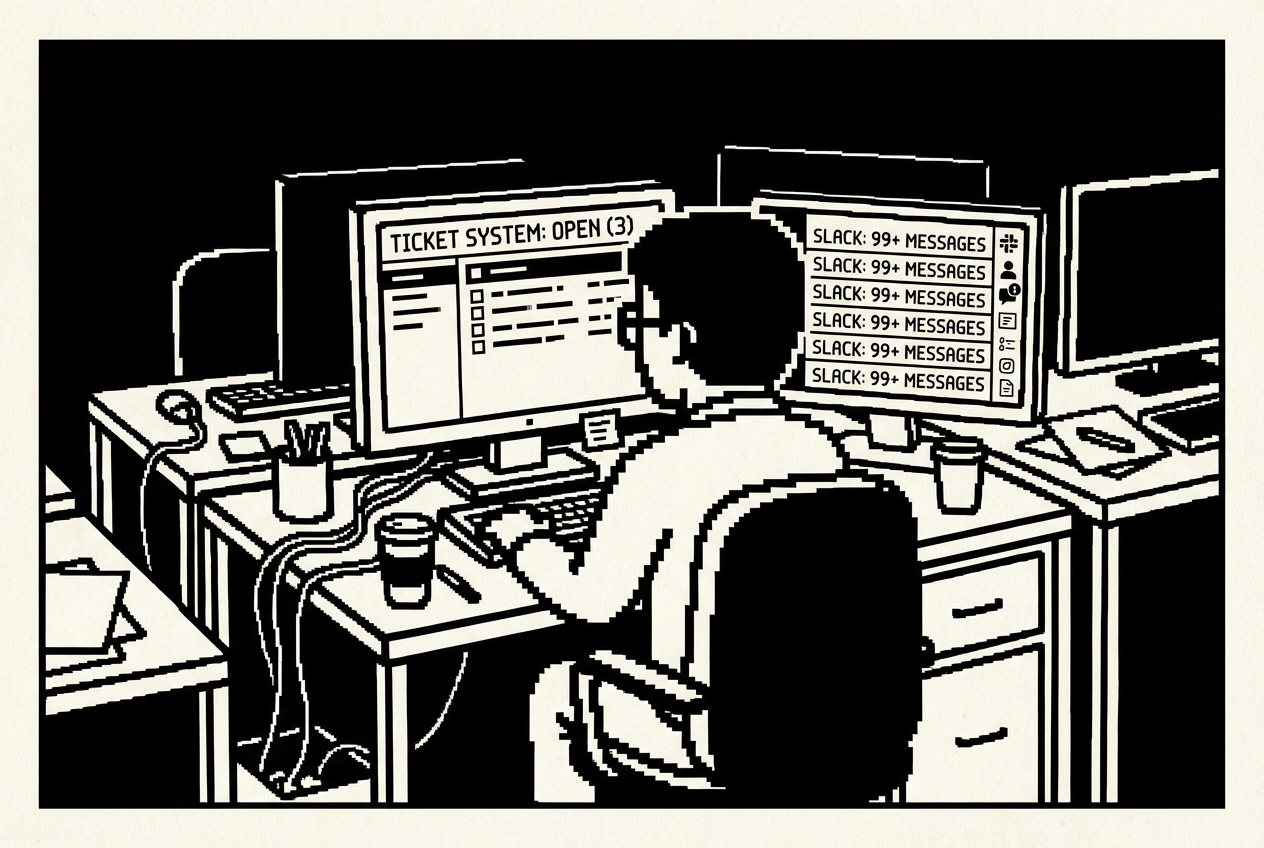
Raj's Monday morning: seven tickets, fourteen Slack messages, one three-person team
Ten subscriptions you can cancel, downgrade, or stop renewing. Built by the team that already knows how to deploy.
Raj stared at the Slack notification and felt his jaw tighten. It was 8:02 AM on a Monday, and someone in accounting had forgotten their VPN password over the weekend. Again. The same person. The same question. The third time in two months.
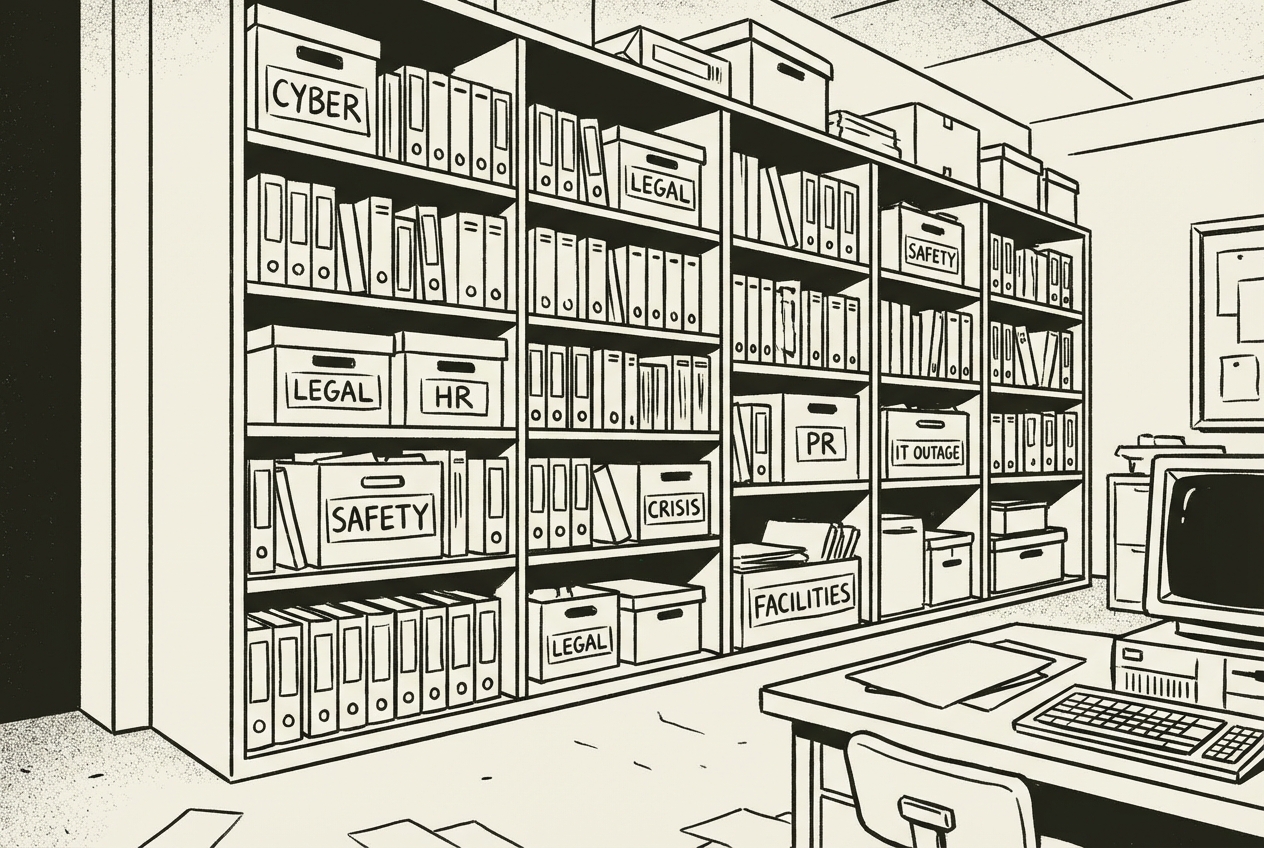
He typed the reset instructions from memory. His fingers could do it while the rest of his brain processed his actual to-do list: patch the staging server, review the new firewall rules, prepare for the quarterly security audit, and figure out why the third-floor printer had started eating paper again. The VPN instructions lived in a Google Doc somewhere. In a shared folder called "IT Documentation" that contained 847 files organized by whoever had created them four years ago, before Raj was hired. Finding anything in there took longer than just answering the question directly.
He managed IT for a 70-person company. Not a startup playing pretend, not an enterprise with layers of middle management and a help desk staffed by twenty people. A real, mid-sized operation where the IT team was him, one junior admin named Deepa, and a part-time contractor named Viktor who handled the network closet on Wednesdays and Fridays. Three people keeping 70 running. Three people standing between a productive workday and "my screen is black and I have a presentation in ten minutes."
Raj's morning routine was predictable. Open the ticketing system. Seven new tickets, five of which were documented somewhere in the scattered landscape of Google Docs, Confluence pages, and Slack bookmarks that passed for their knowledge base. Open Slack. Fourteen direct messages, nine of which could be answered by reading documentation if anyone knew where the documentation lived or trusted that it was current. Open the SaaS admin panel. Check that nothing expired overnight, that nobody accidentally deleted their own account, that the monitoring tools were still reporting green.
His SaaS stack was a familiar inventory. Confluence for the knowledge base nobody used. SolarWinds for ticket analytics he couldn't access without upgrading. Statuspage.io for the status page he forgot to update during outages. BambooHR's IT onboarding module for checklists that were eight months out of date. KnowBe4 for security training videos that insulted everyone's intelligence. PagerDuty for incident runbooks that existed as half-finished drafts. Snipe-IT for asset tracking that was less accurate than his memory. Scribe for troubleshooting guides nobody could find. G2 Premium for vendor comparisons he used twice a year. ReadMe.io for API documentation that was perpetually stale.
Ten subscriptions. $30,400 a year. Three people who didn't have time to use half of them properly.
This chapter is about taking that back. Ten use cases, each replacing a specific SaaS subscription with something you build in hours, not weeks. Some of these are dead simple, requiring nothing more than a conversation with an AI tool. Some require you to push code to a server, which, given that you're in IT, should feel like home. All of them save real money.
One thing before we start: IT readers don't need hand-holding. You know what a deployment is. You know what a CSV export looks like. You understand APIs, databases, and hosting. So the walkthroughs here will be direct. Less "click this button," more "here's what you tell the tool to build, and here's what you get back."
Raj had a knowledge base. In theory, it was comprehensive. In practice, it was a graveyard.
The Confluence instance had been set up three years ago with the best intentions. Raj spent an entire weekend structuring it. Spaces for IT procedures, hardware guides, software installation walkthroughs, security policies, and FAQ pages. He wrote the first 30 articles himself. They were clear, well-organized, and thorough. He even added screenshots with red annotation arrows, the way the good documentation does it.
Within six months, the wiki had become a monument to his initial enthusiasm and nothing more. New procedures got documented in Slack messages because it was faster. Updated instructions lived in email threads because that's where the conversation happened. The printer configuration that had changed twice since the wiki article was written now existed only in Raj's head and on a sticky note attached to Deepa's monitor.

Every IT team has a knowledge base. And every IT team has the same problem with it: nobody uses it, and the person who maintains it stopped updating it six months ago because nobody uses it. It's a vicious cycle with a $6,000 annual subscription fee stapled to it.
Confluence is the usual suspect, but the pattern holds for any knowledge platform. You're paying somewhere around $6,000 a year for the team plan at a 70-person company. It has powerful features. Macros, templates, page trees, inline comments, integrations with Jira, permission structures that would impress a systems architect. It also has a search function that somehow never finds what you're looking for, an editor that fights you on formatting every time you paste from another application, and a permission model so complex that half your team has accidentally locked themselves out of pages they created.
The irony of knowledge base platforms is that they're optimized for writing documentation, not for finding it. You invest hours creating beautifully formatted articles with embedded diagrams, and then your colleagues search, fail to find what they need because the search algorithm prioritizes page titles over body content, give up after thirty seconds, and message you on Slack anyway.
The real cost isn't the $6,000 subscription. It's the time you spend answering questions that are technically documented somewhere but practically unfindable. Every "how do I" message in Slack is a knowledge base failure. You're paying for the documentation platform and still doing the documentation's job manually. That's paying twice for the same outcome.
The fundamental insight is simple: your knowledge base should be as easy to update as writing a text file, and as easy to search as using Google. Everything else, the macros, the templates, the permission hierarchies, the inline commenting, is overhead that a 70-person company doesn't need.
Open Codex, a desktop command center for parallel AI agents, and give it a clear directive: build a searchable internal knowledge base. You want a web application with a clean interface where IT documentation lives in markdown files, organized by category.
Start by spending one afternoon consolidating your most-referenced documentation. You don't need everything. Start with the twenty documents that answer 80% of the questions your team gets:
Dispatch that as one thread in Codex. In a second parallel thread, tell Codex to create an admin page protected by a simple password with a markdown editor, live preview panel, and a bulk import feature that accepts a ZIP file of markdown documents.
Codex dispatches agents for both threads simultaneously. One processes your documents and builds the search indexing layer and the public-facing interface. The other creates the admin functionality. Review the diffs when they're done. Accept the changes and push to GitHub.
On Railway, connect the repo. Railway detects the project type, sets up the build process, and deploys. Within two minutes you have a live URL. Share that URL with your team in Slack. Pin it in the IT support channel.
Here's the operational shift that matters most: when someone asks you a question on Slack, instead of typing the answer, send them the knowledge base link. "Here's the guide: [link]." This does two things. It answers their question immediately, and it trains them to check the knowledge base first next time. Over weeks, the volume of direct questions drops because people learn that the knowledge base actually works.
Adding new articles means writing a markdown file and pushing it to the repo. Or using the admin interface you built. Either way, it takes less time than navigating Confluence's editor. And because the articles are just markdown files in a Git repository, you get version history for free.
Confluence team plan ($6,000/yr), Notion team workspace ($4,000/yr+), or Document360 ($3,600/yr+)
Full cancellation of knowledge base platform
Every Monday morning, Raj's director asked the same question in their weekly standup: "What are the big trends in IT support this month?" And every Monday morning, Raj gave some version of the same answer: "Lots of password resets, a few VPN issues, the usual printer stuff." It was vague because the data was vague. Or rather, the data was precise but trapped inside a ticketing system that charged extra for the privilege of analyzing it.

Raj had a feeling that the third-floor printer was the most expensive piece of equipment in the building. Not because of its purchase price, but because of the hours his team spent troubleshooting it. He couldn't prove it. His ticketing system tracked individual tickets fine. Open, assign, resolve, close. What it couldn't tell him, at least not without upgrading to the analytics tier, was patterns.
SolarWinds Service Desk charges around $4,000 a year for its analytics tier. Freshservice has a similar pricing structure for advanced reporting. You're paying for dashboards that show you ticket volume over time, average resolution speed, SLA compliance percentages, and category breakdowns in pie charts. These dashboards look impressive in a slide deck. They are almost useless for making actual decisions.
The dashboards show you what. They don't show you why. "Ticket volume was up 12% this quarter" is a fact. "Ticket volume was up 12% this quarter because VPN issues tripled after the SSO migration in March, while printer tickets remained stable and password resets actually decreased following the self-service rollout" is an insight. The first statement gets a nod in a meeting. The second one gets a budget allocation.
The approach is straightforward: take the data you already have, run it through an analysis that asks the questions you actually care about, and get a report you can act on. Not a dashboard you have to interpret. A report with sentences and recommendations.
Export your ticket data as a CSV. Most ticketing systems let you do this with a few clicks. You want the columns that matter: date opened, date closed, category, subcategory, priority, department of the requester, resolution time in hours, description or summary text, status, assigned agent, and whether the ticket was reopened. Pull the last twelve months.
Claude Code reads the CSV, writes a Python analysis script, executes it, and returns a structured report. Not a dashboard full of charts you have to interpret. A report with actual sentences: "Password reset requests increased 34% quarter-over-quarter, driven primarily by the sales department after the SSO migration in March. At an average resolution time of 18 minutes and a current volume of 47 per month, password resets cost approximately $1,057 in IT staff time this quarter alone. Recommendation: implement self-service password reset to reclaim an estimated 14 hours per month."
The recurring issues detection is the most valuable piece. It surfaces patterns you feel intuitively but can't articulate with data. "We get a lot of printer tickets" becomes "Printer tickets represent 23% of all hardware tickets, with 67% originating from Floor 3, concentrated on Monday and Tuesday mornings. This single printer accounted for 19% of all hardware-related tickets over the past six months." That level of specificity turns a vague complaint into a capital expense request.
Want this as a recurring process? Tell Claude Code to build a reusable script that takes any CSV in this same column format and generates this same report. Include a command-line argument for the date range. Output as both markdown and formatted HTML. Now you have an analysis pipeline. Export your tickets once a month, run the script, send the report. Five minutes of work instead of an afternoon of spreadsheet wrestling.
SolarWinds Service Desk analytics tier ($4,000/yr), Freshservice advanced reporting ($3,600/yr+)
Cancel analytics add-on, keep core ticketing system
The great outage of last November. Email went down at 9:14 AM on a Tuesday. By 9:16 AM, Raj's phone was buzzing with Slack messages. By 9:20 AM, three people had walked to his desk. By 9:25 AM, his director called. By 9:30 AM, the CEO's assistant sent an email, from her personal Gmail account, asking when email would be back up. By 9:35 AM, Raj was troubleshooting the mail server while simultaneously typing "we're looking into it" into seven different Slack conversations.
The status page, the one he'd set up on Statuspage.io six months earlier specifically for situations like this, still showed "All Systems Operational" in cheerful green. Because Raj was busy diagnosing the email server, not logging into a status page platform with a password he'd forgotten because he only used it once every few months.
When something goes down at a company your size, the first thing that happens isn't a fix. It's a flood of messages. "Is email down?" "Is the VPN working?" "My Slack isn't loading, is it just me?" Each message interrupts whatever you're actually doing to resolve the outage.
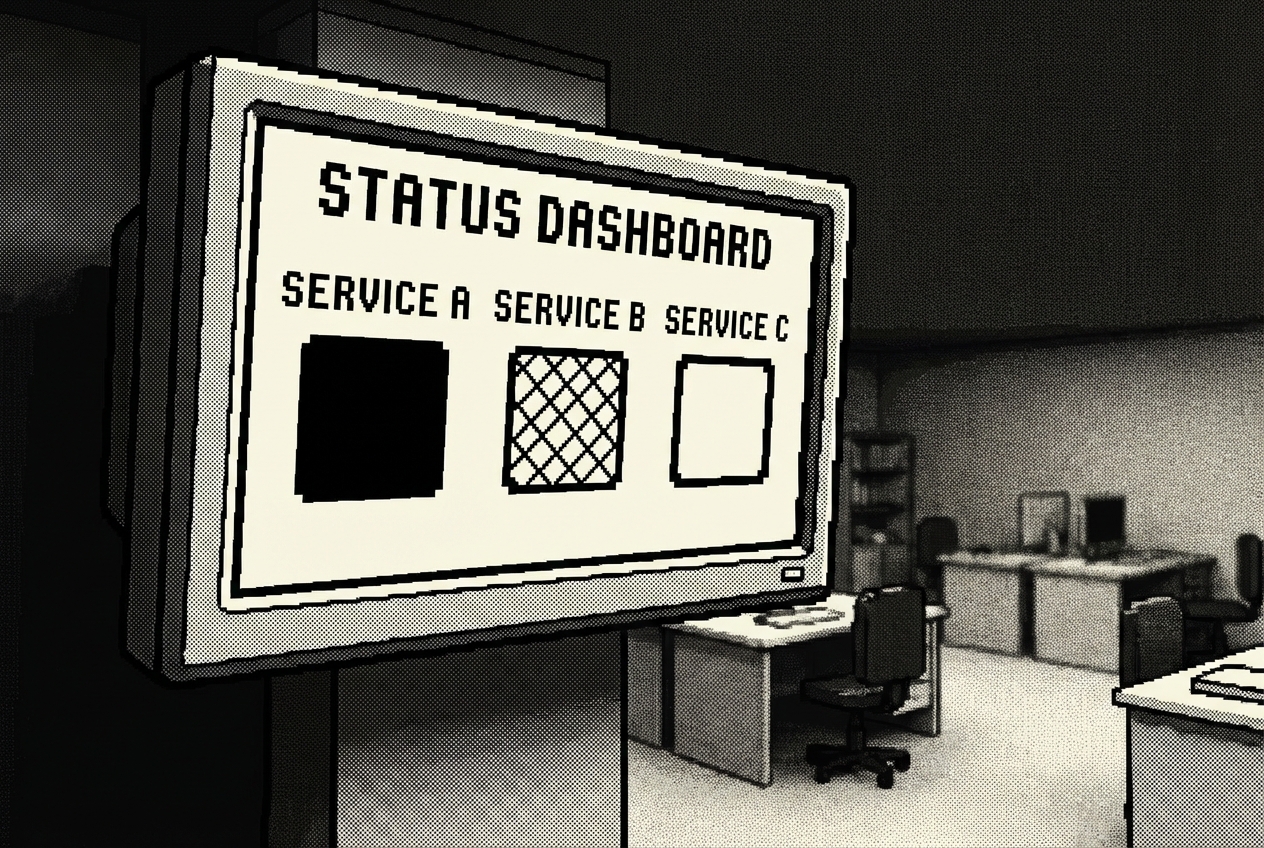
Statuspage.io charges about $2,400 a year for a team-facing plan. All of them do more than you need. Automated monitoring integrations, incident timeline tracking, subscriber notifications with email digests, post-mortem templates, component-level status tracking, scheduled maintenance windows. You need a page that says "email is working, VPN is working, the CRM is experiencing issues, we're looking into it."
What you actually need is something so simple that updating it takes less than ten seconds. Even during an incident. Even from your phone. Even while you're SSHing into a server with your other hand. A page with colored dots, a note field, and a big update button.
Open Google AI Studio, a free browser-based platform that builds apps from descriptions, and tell it what you want in plain language:
AI Studio's Build mode generates a React application. Within minutes, you'll see the public dashboard with your service list, color-coded status indicators, the admin panel, and the history log. Use Annotation mode to adjust the layout. Make sure the admin interface is mobile-responsive, because you will absolutely be updating this from your phone while standing in the server room.
Deploy it on Railway. Share the public URL with your entire company. Post it in the all-hands Slack channel. Set it as a pinned message. Display it on the lobby TV.
Bookmark the admin URL on your phone. When something goes down, unlock your phone, open the bookmark, select the service, tap "Outage," type "Investigating," hit save. Ten seconds. You go back to fixing the actual problem.
One important distinction: this replaces the status page, the communication layer. It does not replace your monitoring stack. You're still updating statuses manually based on what your monitoring tools detect. For a 70-person company where the IT team knows about outages within minutes through their existing monitoring, manual updates are fast enough.
Statuspage.io ($2,400/yr), BetterUptime status features ($2,400/yr), or Cachet hosted ($1,200/yr+)
Full cancellation of status page platform
Raj had onboarded 23 people in the last year. Twenty-three small projects, each slightly different from the last. Not because the tasks were hard, but because there were so many of them, and the combination changed depending on who was being onboarded and where they'd be working.
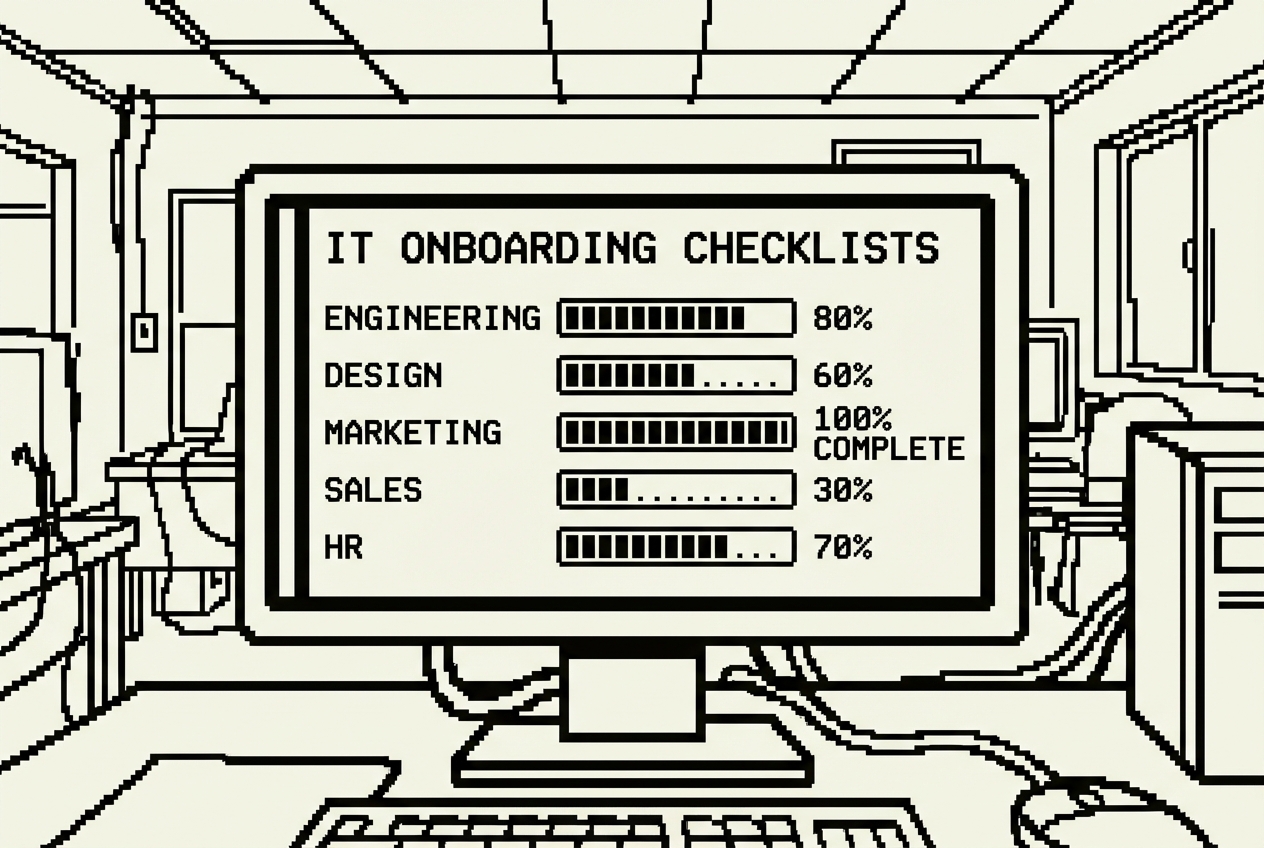
New hire day in IT is a controlled scavenger hunt. Create the Google Workspace account. Set up the laptop. Provision Active Directory access. Add to the correct security groups. Configure VPN access. Enroll them in multi-factor authentication. Add them to the right Slack channels. Set up the desk phone. Configure the printer drivers. Ship the hardware if they're remote.
And somehow remember which of these 30-odd steps applies to engineering versus marketing versus finance versus the new VP who needs everything plus a direct phone line. Because the access requirements are different for each. Engineering needs GitHub organization access, development environment setup, CI/CD pipeline credentials. Marketing needs Figma licenses, social media management platform credentials, CMS admin access. Finance needs ERP system access, expense management tool setup, restricted file share permissions.
You might have a checklist. Raj had one in a spreadsheet. Column A listed the tasks. Columns B through G marked which departments needed which tasks. In practice, the spreadsheet was last updated eight months ago. Engineering had switched from Bitbucket to GitHub four months ago, but the checklist still said "Add to Bitbucket." The VPN instructions referenced a client the company stopped using in January.
Open Claude and describe what you need. Be thorough, because the more detail you provide, the more useful the checklist will be from the start.
Claude generates an interactive Artifact right in the conversation. You'll see a clean interface with the input fields at the top, a dropdown to select the department, and a categorized checklist that dynamically changes based on the selection.
The shared items appear on every department's list regardless of selection: Google Workspace or Office 365 account creation, Slack workspace invitation with correct default channels, VPN configuration, MFA enrollment, laptop setup, standard software installation, and security training assignment. The department-specific items appear only when that department is selected.
Share the Artifact link with Deepa. She can now run onboarding independently for most departments. She opens the checklist, enters the new hire details, selects the department, and works through it systematically. When she's done, she generates the summary and sends it to the hiring manager. You review the completed checklist in two minutes instead of spending an hour doing the onboarding yourself.
Need to update the list? Tell Claude: "Add 'Enroll in Okta SSO' to all department checklists under the Accounts category." Done. Each update takes thirty seconds. No workflow builder to navigate. No admin interface to log into.
There's a secondary benefit that's easy to overlook: institutional knowledge preservation. When the checklist is comprehensive and current, it captures your onboarding process in a format that survives staff turnover. If you leave the company tomorrow, the next IT manager has a complete, accurate picture of what it takes to onboard someone in each department.
BambooHR/Rippling IT onboarding module ($1,200/yr partial)
Cancel onboarding module, keep core HR platform
Every quarter, Raj sent the same company-wide email with the same subject line: "Q[X] Security Awareness Training, Please Complete by Friday." And every quarter, the same dance. About 40% of the company completed it on time. Another 30% finished after Raj sent a reminder. The remaining 30% required individual Slack messages, some of which went unanswered until Raj CC'd their manager.
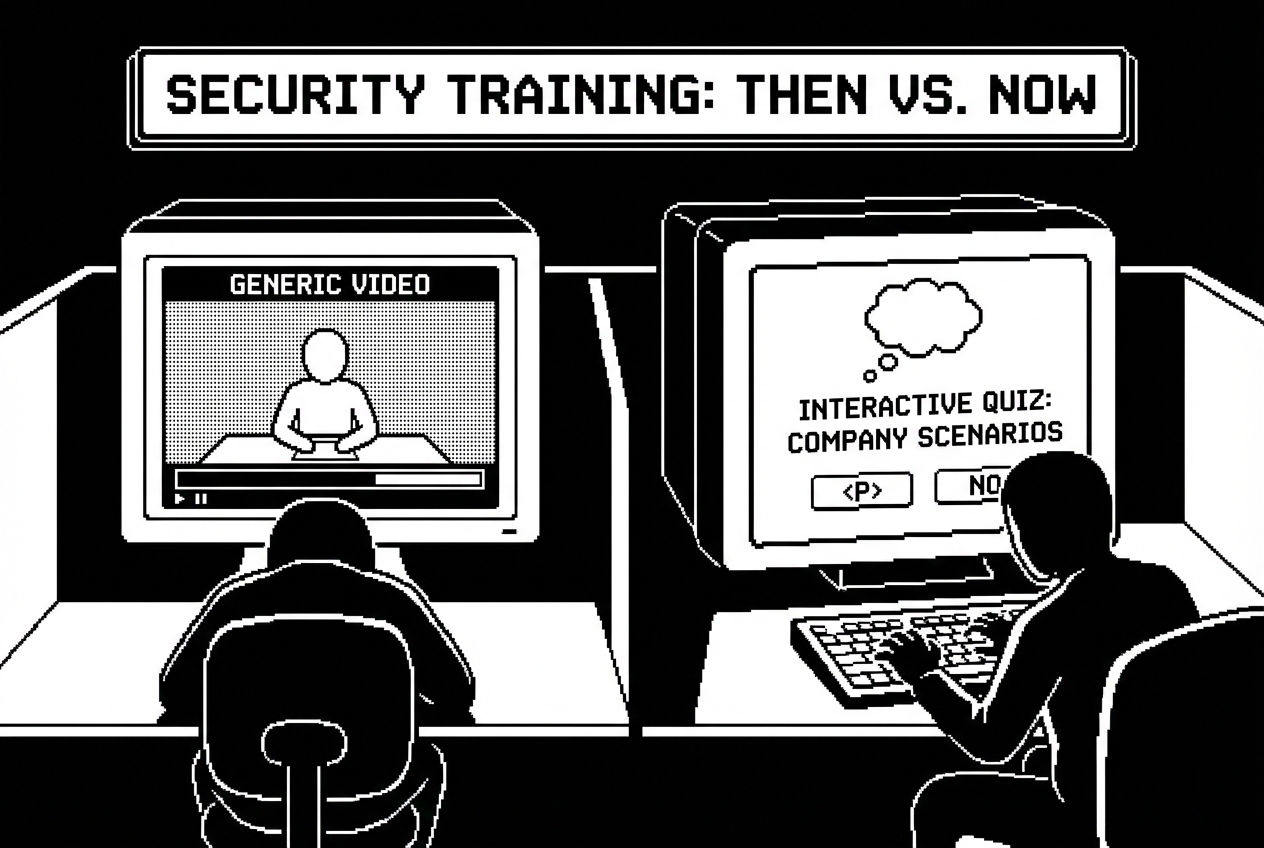
The training itself was a 20-minute video featuring actors in a generic office setting explaining concepts like "don't click suspicious links." The video was followed by a 10-question quiz with questions like "True or False: You should never share your password with anyone, even your IT department." The company-wide pass rate was 97%. Not because everyone had become security-savvy. Because the questions were that easy.
KnowBe4 charges around $3,000 a year for a 70-person company and delivers exactly what the compliance checkbox requires: training content, a quiz, a completion certificate, and an admin dashboard. The training covers the fundamentals. But it's generic in a way that actively undermines its own purpose. The phishing examples show obviously fake emails from "Amaz0n" with Comic Sans subject lines. Meanwhile, the real phishing attempts hitting your company's inboxes are pixel-perfect replicas of DocuSign signing requests using your actual company name.
You're paying $3,000 a year for content that fails to connect with the specific risks your employees actually face. The dashboard tells you that 94% of employees "passed" the training. It doesn't tell you whether anyone actually learned anything, retained it past Friday, or changed their behavior when a real phishing email arrived the following week.
Tell Claude to build something that actually teaches, not just tests:
Claude builds a polished, interactive quiz. Now customize it. Tell Claude to replace the phishing examples with ones that specifically target your organization, using your company domain, your CEO's name, your actual tools. Create phishing emails with spoofed sender addresses that are subtly wrong, like sarah.chen@acmetech-hr.com instead of sarah.chen@acmetech.com.
Now your employees are training against the actual threat patterns they'll encounter. Not generic Nigerian prince emails. Sophisticated, targeted phishing that uses names, tools, and references they recognize from their daily work.
Build role-specific versions for departments with elevated risk profiles. A version for the finance team with additional questions about wire fraud scenarios and invoice manipulation attempts. A version for executives with scenarios about whaling attacks and credential harvesting through fake board meeting invitations.
Share the link quarterly. Update the phishing scenarios each cycle by pasting in sanitized versions of actual phishing attempts your company received. Your employees are now training against the exact attacks targeting your organization, updated every quarter.
The honest comparison: this does not replace simulated phishing campaigns where you send fake phishing emails to employees' actual inboxes and track who clicks. That's KnowBe4's strongest feature. If your security program relies heavily on phishing simulation, keep it. What this replaces is the training content, the awareness modules that employees click through for compliance.
KnowBe4 basic tier ($3,000/yr partial), Proofpoint security awareness features
Partial replacement, keep dedicated phishing simulation if actively used
At 2:37 AM on a Wednesday in October, Raj's phone buzzed with a monitoring alert. Database connection pool exhausted. The staging server had crashed, and based on the cascade of alerts that followed over the next ninety seconds, production wasn't far behind.
He rolled out of bed, opened his laptop on the kitchen counter, and stared at the screen. He knew what to do. He'd handled something similar eight months ago. But "something similar" and "exactly this" are different at 2:37 AM when your brain is running at 40% capacity. Was the first step to restart the connection pool or to check the application logs? Should he page the developer on call, or was this an infrastructure issue he could handle himself?
He had an incident response document. Somewhere. He searched Confluence for "incident response" and got 14 results, three of which were drafts he'd abandoned, one was an empty template, one was a plan from 2021 that referenced three people who no longer worked at the company, and the rest were meeting notes that mentioned the phrase in passing.
PagerDuty's runbook features or Jeli.io's incident documentation tools cost around $1,800 a year and give you structured templates, timeline tracking, and collaboration features during incidents. They're well-designed products. But the problem with incident playbooks isn't the format, the storage platform, or the collaboration features. It's that writing them is tedious, nobody gets recognized for documentation work, and by the time you need a playbook at 2:37 AM, the document is stale because three people have changed roles and two tools have been replaced since it was written.
Set up a folder structure first. This matters because Cowork, an autonomous agent that works with your files, reads everything in the folder to build context.
Populate the context folder with everything relevant to your organization's incident handling. Your current security policy, your communication policy, an escalation contacts document with current names, titles, phone numbers, and Slack handles. An infrastructure overview describing your key systems and their dependencies.
Walk away. Cowork reads your organizational context, processes your past incident history, and generates eight structured playbooks plus a quick-reference severity guide. When you come back, each playbook is a standalone document with actionable steps tied to your specific infrastructure, your actual contact names, your real tools.
Review them carefully. Check that the contact information is current. Verify the technical steps match your actual infrastructure. The structure is there, the flow is logical, the escalation paths reference real people, and the hard part, getting comprehensive, actionable content written, is done.
The update cycle is what makes this approach sustainable. When someone leaves the company, update the escalation-contacts.md file and regenerate the affected playbooks. After an actual incident reveals gaps, add the post-mortem to past-incidents and ask Cowork to revise that specific playbook.
One operational note: print the severity guide and the most critical playbooks and keep physical copies in a labeled binder near the server room. If the incident involves a network outage that takes down your file access, Confluence, and Slack simultaneously, you need documentation you can reach without a network connection.
PagerDuty runbook features ($1,800/yr), Jeli.io documentation ($2,400/yr)
Cancel runbook add-on, keep core alerting and on-call scheduling
The email came from HR on a Thursday afternoon, two words past the subject line telling Raj everything he needed to know: "Equipment return, Marcus Rivera, Engineering, last day next Friday."
Raj opened the asset tracking spreadsheet. According to the spreadsheet, Marcus had a Dell Latitude 5520 issued in January 2023, a 27-inch Dell monitor, and a standard peripheral kit. But Marcus worked from home, 400 miles away. And Raj vaguely remembered that Marcus had asked for a second monitor about three months ago, which someone, probably Deepa, had shipped from spare inventory without updating the spreadsheet. There might also be a docking station.
Asset tracking is the chore that never ends and never feels done. At a 70-person company, you're managing somewhere between 200 and 400 individual assets. Every new hire means issuing 4 to 8 pieces of equipment. Every departure means collecting them. Or trying to. And somewhere in between, things get quietly reassigned without documentation.
Snipe-IT Cloud, AssetPanda, or Lansweeper runs about $4,800 a year for a company your size. These tools have features. Barcode scanning (which requires purchasing barcode printers you'll never buy), automated network discovery (which finds devices but can't tell you who's using them), depreciation tracking (which your accounting team handles in their own system). They have 40 features. You need four: search, add, edit, and export.
The one thing you actually need, a fast answer to "who has the MacBook with serial number C02FK1XXXXX?", requires logging into the platform, navigating past the dashboard, selecting the right filter, and entering the serial number. What should take five seconds takes forty-five.
Open Codex and describe the asset tracker you actually need. Be specific about what matters and deliberate about what you're leaving out.
Codex dispatches agents and builds the dashboard, employee view, and reporting page in parallel. The dashboard gives you the morning overview: 47 laptops deployed, 3 in storage, 2 flagged for repair, 5 warranties expiring this quarter. The employee view eliminates the offboarding detective work. The reporting page gives you audit-ready exports.
Push to GitHub. Deploy on Railway. Import your existing spreadsheet on day one, messy data and all. The CSV import with preview and column mapping handles the imperfect data in your current spreadsheet.
From that point forward, updates happen in the app. When Deepa ships a monitor to a remote employee, she opens the app, finds the monitor in unassigned inventory, assigns it, updates the location, adds a note with the FedEx tracking number, and saves. Fifteen seconds.
The warranty expiration alerts are the quiet hero. A laptop with a warranty expiring next month can be sent in for free diagnosis and repair. A laptop with an expired warranty that develops a display issue is a $1,200 replacement. The alert costs nothing. Missing it costs real money.
When Marcus in engineering gives his notice and the HR email arrives, you pull up his employee view. Every asset he has is listed. You generate the offboarding checklist, send it to Marcus with a return shipping label and the list of items expected back, and track the returns as each box arrives. No detective work. No guessing.
Snipe-IT Cloud ($4,800/yr), AssetPanda ($3,600/yr+), or Lansweeper ($4,200/yr)
Full cancellation of asset management platform
You know the pattern by heart because you've lived it a thousand times. Someone submits a ticket: "Printer not working." You respond: "Which printer? What happens when you try to print? Does it show an error message?" Four messages and 45 minutes of elapsed time later, you discover they just needed to select the right printer from the dropdown menu. A problem that should have taken 30 seconds to self-solve consumed time from two people across an entire morning.
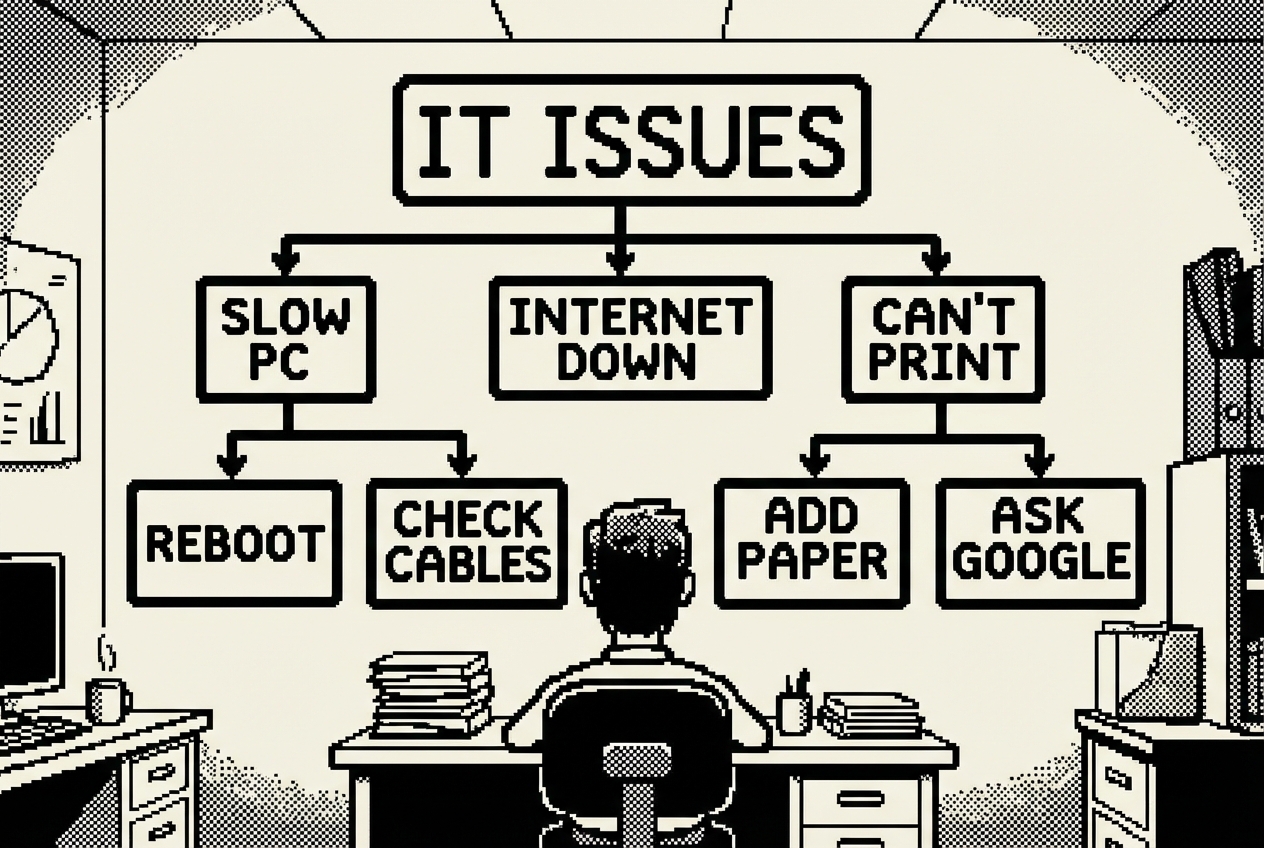
Each common IT issue has a diagnostic tree in your head, a branching series of questions that narrows the problem from "not working" to its actual root cause. You've internalized these trees through years of repetition. You can diagnose a printer issue in three questions. You can identify a VPN problem in four. The problem is that you're the only person who has these diagnostic trees.
The format is the fundamental issue. A static document doesn't work for troubleshooting because it presents all information linearly. If you have a printer problem, a linear document forces you to read through the WiFi printer section, the USB printer section, the paper jam section, the driver section, and the network section. People won't do that. They'll read the first two paragraphs, get overwhelmed, close the document, and message you.
What works for troubleshooting is an interactive decision tree. "Is your printer connected via WiFi or USB?" sends you down one of two paths. The user follows only the questions relevant to their specific situation and arrives at either a solution or a pre-filled support ticket.
Scribe and Tango charge around $2,400 a year for documentation platforms that create step-by-step guides with automatic screenshots. They're excellent for documenting linear procedures. They're less effective for troubleshooting because troubleshooting isn't linear. It branches.
Open AI Studio and describe the interactive troubleshooting system you want:
AI Studio builds the entire application with the category grid and the branching flows. Now customize every flow for your actual environment. The printer troubleshooting flow should reference your actual printers by name and location. The WiFi flow should name your actual networks. The VPN flow should reference your actual VPN client.
Build the diagnostic trees from your actual experience. You know the distribution of root causes: wrong printer selected in the dropdown (roughly half of all printer tickets), printer offline and needs restart (about 20%), driver issue (about 15%), network connectivity (about 10%), and actual hardware failure (about 5%). Structure the flow so the most common cause is checked first.
Deploy on Railway and share the URL everywhere. Pin it in the general IT support Slack channel. Set it as an auto-response in your ticketing system: "Before submitting a ticket, please try our troubleshooting guide: [link]."
The impact is measurable. Your team self-solves 60 to 70% of the common issues that currently generate tickets. The tickets that do come through arrive pre-loaded with diagnostic context, so you skip the entire back-and-forth conversation. What used to take four messages and 45 minutes now takes one message and 5 minutes.
There's a virtuous cycle between the troubleshooting guides and the ticket trend analyzer. The analyzer tells you which issues are most common and most costly. The guides address those specific issues with self-service solutions. The next quarter's analysis shows whether the guides are working. The data tells you where to invest your guide-building time next.
Scribe ($2,400/yr), Tango ($2,400/yr), or custom documentation platforms
Full cancellation of documentation platform
Every significant IT decision eventually becomes a vendor comparison. New backup solution because the current one failed during the last disaster recovery test? Compare four vendors. Switching MDM platforms because the current one can't handle the latest macOS version reliably? Three contenders. Evaluating SIEM tools because the board wants better security visibility? Five options, each with different pricing models.

The process is always the same. You identify a shortlist, usually three to five vendors. You book demos, losing 45 minutes to an hour per demo. You take notes in various formats. You try to compare notes from memory. You build a spreadsheet.
G2 Premium or TrustRadius enterprise access costs about $1,200 a year and gives you peer reviews, side-by-side comparison charts, and curated vendor reports. They're useful for the research phase. But when it comes time to present a recommendation to your director or the CFO, you need a structured analysis based on your specific requirements, your specific weighting of what matters, and your specific pricing quotes.
The problem with flat spreadsheets for vendor comparison is that they treat every criterion equally. A feature checklist where "supports SSO integration" and "has a mobile app" get the same visual emphasis is misleading. SSO might be a hard requirement that eliminates vendors outright. The mobile app might be a nice-to-have that nobody asked for.
Claude generates a comprehensive, interactive evaluation tool. The interface is clean: vendor columns across the top, evaluation criteria organized by category down the left, rating inputs and note fields in each cell. As you fill in ratings, the weighted scores calculate in real time.
The critical gaps detection is the most valuable feature for executive presentations. It surfaces dealbreakers immediately. "Vendor C scored highest overall at 87 points, but has critical gaps in GDPR compliance (rated 2, importance 5) and data residency options (rated 1, importance 4). We recommend Vendor B, the second-highest scorer at 82 points, which has no critical gaps and meets all hard requirements."
That presentation lands differently than a spreadsheet with 47 cells. Your criteria. Your weights. Your research. A clear recommendation backed by transparent, structured analysis that anyone in the room can follow.
Reuse the tool for every vendor evaluation. New procurement decision? Open the same Artifact, clear the vendor data, adjust the categories and weights. Save previous evaluations by copying the Artifact before clearing. Build an archive of past vendor analyses that documents how your team makes procurement decisions.
G2 Premium ($1,200/yr), TrustRadius enterprise features ($1,800/yr)
Full cancellation of vendor comparison subscription
If your company builds software, whether internal tools, customer-facing products, or integrations between systems, you have APIs. And those APIs need documentation. This is the place where IT and engineering overlap, and the documentation problem falls squarely into the gap between them. Developers write the APIs and consider documentation somebody else's responsibility. IT manages the infrastructure the APIs run on and considers documentation an engineering concern. The result is that nobody owns it.
ReadMe.io, Stoplight, or SwaggerHub charge around $3,600 a year for hosted API documentation with features like interactive "try it out" testing, versioning, collaboration, and search. These platforms produce documentation that looks beautiful. They also require someone to actively maintain the documentation separately from the code, and this is where the system breaks down.
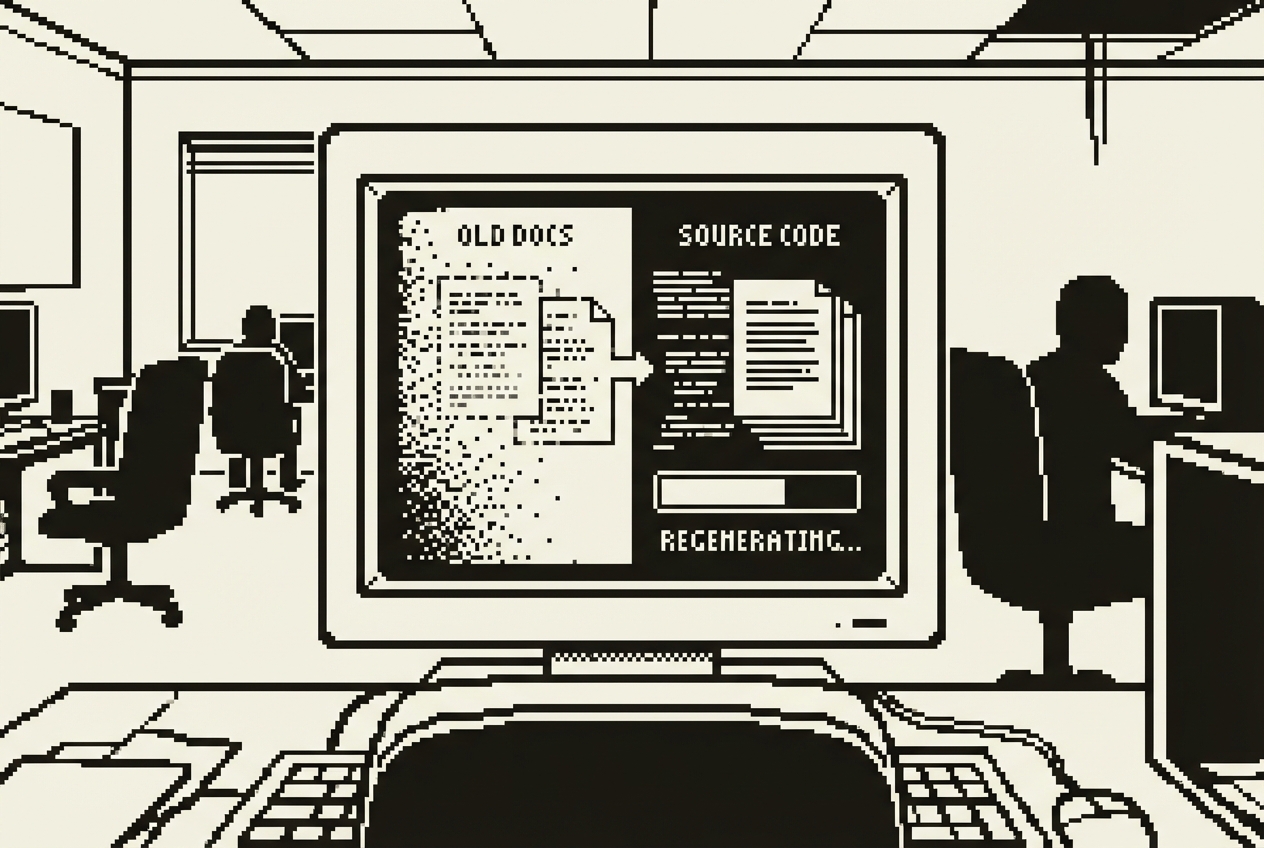
An endpoint gets added. The developer ships the code. The documentation doesn't get updated because updating it means logging into a separate platform. A parameter changes from optional to required. The code ships. The documentation still shows it as optional. Within three months, the documentation has become a rough approximation of the actual API.
The engineering team knows the docs are stale. They've stopped trusting them and started reading the source code directly. The new developer who was supposed to learn the API from the documentation gave up after the third endpoint returned fields the docs didn't mention. The partner integration team sent a frustrated email cataloguing the "discrepancies between the documentation and actual behavior."
If your company doesn't build software or maintain APIs, skip this one and count the savings from the other nine. This is the most technical build in the chapter.
This is the most hands-on build in this chapter. You need access to your API codebase and comfort with the terminal. Claude Code, a terminal-based AI coding agent, does the analytical and generative work. You point it at the code and review what it produces.
Claude Code scans your codebase systematically. It reads route definitions, TypeScript interfaces, Zod schemas, Mongoose models, middleware chains for authentication and rate limiting, and existing code comments. Then it generates a complete documentation website with all of this information organized, formatted, and rendered.
Review the generated documentation against your actual API. Pick five or six endpoints and verify them manually. There will be gaps. Business logic that isn't visible in the type signatures. Multi-step authentication flows. Address these by telling Claude Code to make specific corrections.
When the documentation is accurate, push to GitHub. Deploy on Railway. The documentation site is live at a stable URL within minutes. Share that URL with your engineering team, your partner integrations team, and new developer hires.
The refresh cycle is what makes this sustainable. When the API changes, pull the latest code, open Claude Code, tell it to re-scan and regenerate, review the diff, push to GitHub, and Railway deploys automatically. Five to ten minutes. Compare that to the hours of manual documentation editing you're supposed to be doing, or the zero documentation updates happening because nobody has time.
For teams with a CI/CD pipeline, you can go further. Add the documentation generation as a step in your deployment workflow. The docs can't drift from the code because they're generated from the code on every release.
One limitation to acknowledge: auto-generated documentation captures the structure of your API but not the narrative context. It can document that the /users endpoint accepts a "role" parameter, but it can't explain why role-based filtering matters for your application's permission model. For that kind of contextual documentation, you'll want to add a "Getting Started" guide and an "Architecture Overview" section manually.
ReadMe.io ($3,600/yr), Stoplight ($4,200/yr), or SwaggerHub ($3,000/yr)
Full cancellation of API documentation platform
Every number below matches the individual use case breakdowns above. Raj's IT stack went from ten subscriptions to the ones that actually needed to exist.
| Use Case | Tool Replaced | Action | Savings |
|---|---|---|---|
| 1. Knowledge Base | Confluence Team License | Cancelled | $6,000 |
| 2. Ticket Trend Analyzer | SolarWinds Analytics Tier | Cancelled | $4,000 |
| 3. Status Page | Statuspage.io | Cancelled | $2,400 |
| 4. Onboarding Checklist | BambooHR IT Onboarding Module | Cancelled | $1,200 |
| 5. Security Training | KnowBe4 Basic | Cancelled | $3,000 |
| 6. Incident Playbooks | PagerDuty Runbook Features | Cancelled | $1,800 |
| 7. Asset Tracker | Snipe-IT Cloud | Cancelled | $4,800 |
| 8. Troubleshooting Guides | Scribe | Cancelled | $2,400 |
| 9. Vendor Comparison | G2 Premium | Cancelled | $1,200 |
| 10. API Documentation | ReadMe.io | Cancelled | $3,600 |
| Gross IT SaaS Savings | $30,400/yr | ||
The AI tools used in this chapter. The Claude Max and ChatGPT Plus subscriptions are shared across all departments. The full annual cost is attributed here for the most conservative possible savings estimate.
| Tool | Monthly Cost | Covers | Annual |
|---|---|---|---|
| Claude Max (Cowork + Code + Artifacts) | $200/mo | Use Cases 2, 4, 5, 6, 9 | $2,400 |
| ChatGPT Plus (Codex App) | $20/mo | Use Cases 1, 7 | $240 |
| Google AI Studio | Free | Use Cases 3, 8 | $0 |
| Railway (hosting ~5 apps) | ~$25/mo | Use Cases 1, 3, 7, 8, 10 | $300 |
| Total AI Tool Cost | $2,940/yr | ||
Beyond the dollars, count the hours. For a three-person IT team where every hour is already spoken for, recovered time matters as much as recovered budget.
The knowledge base answers questions before they become Slack messages to you. Conservative estimate: 5 hours per week of interruptions eliminated, or 260 hours per year. The troubleshooting guides enable self-service for 60-70% of common issues, reducing ticket volume. At 40 tickets per week and a 20% reduction, roughly 2.5 hours per week, or 130 hours per year. The ticket trend analyzer replaces quarterly spreadsheet wrestling with a five-minute script execution, saving approximately 48 hours per year. The onboarding checklists let Deepa run onboardings independently, freeing 3-4 hours per new hire across approximately 15 hires per year, or 52 hours annually. The status page eliminates the flood of "is it just me?" messages during outages. The incident playbooks reduce panic-driven improvisation during crises. The asset tracker eliminates the offboarding detective work and the audit scramble.
Conservative total: approximately 600 to 700 hours per year returned to your team.
That's the equivalent of getting an extra person for three to four months. Except you didn't hire anyone, you didn't increase headcount, and you didn't add another person to the on-call rotation. You recaptured time that was being consumed by tool maintenance, repetitive question-answering, and manual processes that should have been self-service years ago.
Put differently: 700 hours per year at $75/hour for IT staff time represents $52,500 in labor value. Combined with $27,460 in direct subscription savings, the total value recovered is approximately $80,000 per year. For a three-person IT team, that's enough to fund a meaningful infrastructure project. Or a security upgrade. Or a salary increase. Or simply enough breathing room that your team stops feeling like they're perpetually firefighting.
These tools are not replaced by anything in this chapter:
Ticketing system (Jira Service Management, Freshdesk): Workflow engine, SLA tracking, assignment routing, customer communication, and integration with your entire operational toolchain. The trend analyzer replaces the analytics add-on. The core ticketing system stays.
Monitoring stack (Datadog, New Relic, Prometheus, Grafana): Real-time infrastructure monitoring, alerting, time-series data, and 3 AM pages. The status dashboard replaces the public-facing communication layer. The monitoring that detects problems stays.
Endpoint security (CrowdStrike, SentinelOne, Microsoft Defender): Hardened, constantly updated security tools with threat intelligence feeds, behavioral analysis, and zero-day response. The security quiz replaces awareness training content. The security tools that protect devices stay.
Cloud infrastructure (AWS, Azure, GCP): Your actual hosting and compute. Railway hosts small, low-traffic internal tools. It does not replace production infrastructure, customer-facing services, or databases.
Backup and disaster recovery (Veeam, Commvault, AWS Backup): Data integrity guarantees, replication, failover, and recovery. No AI tool replaces this.
Identity management (Okta, Azure AD): SSO, MFA, identity lifecycle management, and access governance. Core identity infrastructure with compliance implications.
On-call alerting (PagerDuty core): Alerting, escalation, and schedule management stay. The runbook documentation features got replaced by Cowork-generated playbooks.
The Claude Max and ChatGPT Plus subscriptions are shared across all departments in the company. The full annual cost is attributed here for the most conservative possible savings estimate. If you're using these tools across marketing, sales, HR, and IT, the per-department cost is a fraction of the total. Even with the fully loaded cost, the math works.
Five of the ten builds require Railway hosting. These are small, low-traffic internal tools serving 70 users. Railway handles infrastructure, but feature changes mean opening Codex or Claude Code. You're the product owner of your own tools now. For IT teams, this is familiar territory.
Use Case 10 applies only to companies that build software or maintain APIs. If your company doesn't, skip it and count the savings from the other nine. The remaining nine use cases still save $26,800 gross, or $23,860 net after tool costs.
The security quiz replaces training content, not phishing simulation. If your security program relies heavily on simulated phishing campaigns (KnowBe4's strongest feature), keep that capability and cancel only the training tier. If you primarily use KnowBe4 for training and rarely run simulations, this is a direct replacement.
Prices cited reflect typical mid-market configurations as of early 2026. Your actual costs may vary based on team size and billing cycle. Check current pricing before making cancellation decisions.
Raj didn't build all ten of these in a week. Nobody should try to. The approach that worked was deliberate and incremental.
He started with the troubleshooting guides because the repetitive diagnostic conversations were consuming the most visible hours. Building the interactive guides took one afternoon. Deploying them took ten minutes. Within the first week, three people solved their own printer problems using the guide. Within a month, it was clear the approach worked.
Then the knowledge base, because the troubleshooting guides proved a critical point: employees will actually use self-service tools when the tools are simple, specific, and faster than messaging IT.
Then the asset tracker, because an equipment audit was approaching and the spreadsheet was going to embarrass the team. Then the rest, one per week, during the hours freed up by the first three builds. Each build took between one and four hours. Each deployment took under ten minutes. Each subscription cancellation happened at the next renewal date. No disruption. No migration pain.
The IT department is unique in this book because it sits at the intersection of two worlds. You're both a consumer of SaaS tools and a provider of technology services to the rest of the company. You manage everyone else's software while maintaining your own stack.
What this chapter demonstrates is that the tools you build for your department can serve the entire organization. The knowledge base answers questions from every department. The status page is used by everyone in the building. The troubleshooting guides reduce tickets originating from every floor. The onboarding checklist serves every new hire. The security quiz trains the entire company.
This means your IT builds have a multiplier effect that other departments' builds don't. When Marketing builds a content brief generator, it serves Marketing. When you build a knowledge base, it serves 70 people.
The core work didn't change for Raj. He was still managing infrastructure, still patching servers, still keeping systems secure, still fielding 3 AM alerts when something went sideways. He was just doing all of it without paying $30,000 a year for the privilege of managing 10 extra SaaS dashboards on top of everything else. And with 700 hours per year of recovered team capacity, he finally had time for the infrastructure projects that had been sitting in the backlog for two years.
Pick the subscription that annoys you most. Build its replacement this week. Cancel the subscription next month. Repeat until the only tools left on your invoice are the ones that actually earn their keep.
